|
 |
| | | Author: | calsbricks  | | Posted: | Oct 4, 2022 07:50 | | Subject: | 11 Years worth of data now | | Viewed: | 297 times | | Topic: | General | |
|
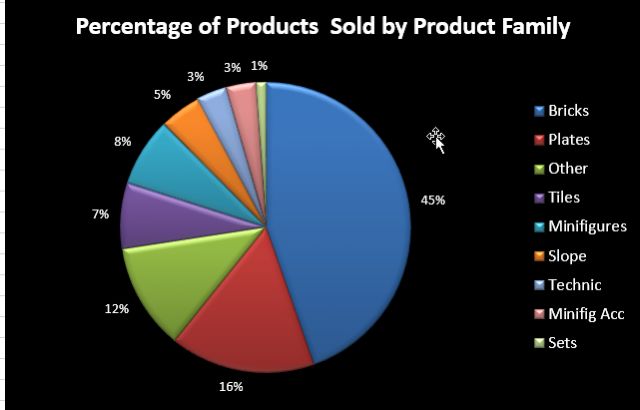
| Our inventory is in direct proportion to this little chart and has been for many
years. It will be differnt breakdowns by different regions, store specialisation
etc.
Our product families are our own internal 1 level up from Bricklink categories
e.g Bricks equals all the sub undeer bricks e.g modified, round etc.
Anybody else produce data like this? I am pretty sure qwertyboy does - right
Niek ?
|
|
|
| | | | | |
| | | | | Author: | tons_of_bricks | | Posted: | Oct 4, 2022 08:05 | | Subject: | Re: 11 Years worth of data now | | Viewed: | 66 times | | Topic: | General | |
|
| In General, calsbricks writes:
| | Our inventory is in direct proportion to this little chart and has been for many
years. It will be differnt breakdowns by different regions, store specialisation
etc.
Our product families are our own internal 1 level up from Bricklink categories
e.g Bricks equals all the sub undeer bricks e.g modified, round etc.
Anybody else produce data like this? I am pretty sure qwertyboy does - right
Niek ?
|
To make sure I'm reading this right, this is based on "times sold", not "value"?
So if this is based off the sales of a 100 items, 8 of those would be minifigures?
I'd be curious to see how a value pie chart based off of the same sales would
differ from this one. My guess is the minifigure pie slice would be quite bigger.
|
|
|
| | | | | | | | | |
| | | | | | | Author: | calsbricks | | Posted: | Oct 4, 2022 08:10 | | Subject: | (Cancelled) | | Viewed: | 57 times | | Topic: | General | |
|
| | (Cancelled) |
|
| | | | | | | | | |
| | | | | | | Author: | calsbricks | | Posted: | Oct 4, 2022 08:13 | | Subject: | Re: 11 Years worth of data now | | Viewed: | 73 times | | Topic: | General | |
|
| In General, firestar246 writes:
| | In General, calsbricks writes:
| | Our inventory is in direct proportion to this little chart and has been for many
years. It will be differnt breakdowns by different regions, store specialisation
etc.
Our product families are our own internal 1 level up from Bricklink categories
e.g Bricks equals all the sub undeer bricks e.g modified, round etc.
Anybody else produce data like this? I am pretty sure qwertyboy does - right
Niek ?
|
To make sure I'm reading this right, this is based on "times sold", not "value"?
So if this is based off the sales of a 100 items, 8 of those would be minifigures?
I'd be curious to see how a value pie chart based off of the same sales would
differ from this one. My guess is the minifigure pie slice would be quite bigger.
|
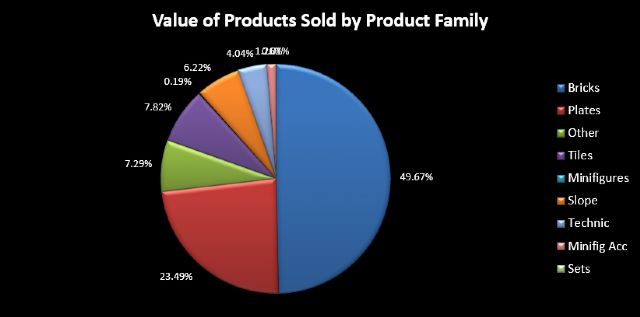
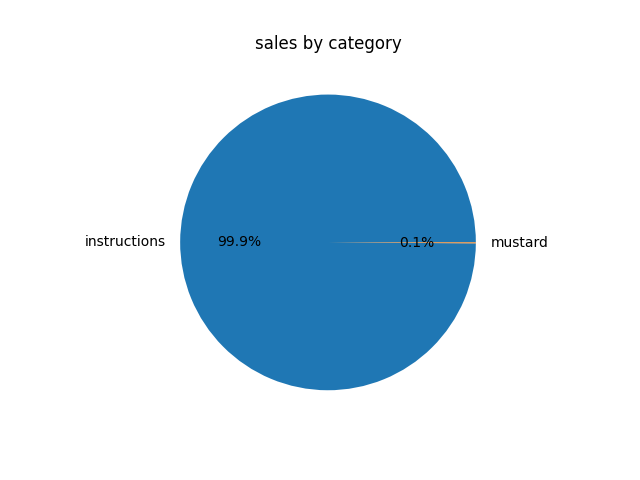
You are
Now look at the Value % as below:
|
|
|
|
| | | | | | | | | | | | | |
| | | | | | | | | Author: | calsbricks | | Posted: | Oct 4, 2022 08:22 | | Subject: | Re: 11 Years worth of data now | | Viewed: | 65 times | | Topic: | General | |
|
| In General, calsbricks writes:
| | In General, firestar246 writes:
| | In General, calsbricks writes:
| | Our inventory is in direct proportion to this little chart and has been for many
years. It will be differnt breakdowns by different regions, store specialisation
etc.
Our product families are our own internal 1 level up from Bricklink categories
e.g Bricks equals all the sub undeer bricks e.g modified, round etc.
Anybody else produce data like this? I am pretty sure qwertyboy does - right
Niek ?
|
To make sure I'm reading this right, this is based on "times sold", not "value"?
So if this is based off the sales of a 100 items, 8 of those would be minifigures?
I'd be curious to see how a value pie chart based off of the same sales would
differ from this one. My guess is the minifigure pie slice would be quite bigger.
|
You are
Now look at the Value % as below:
|
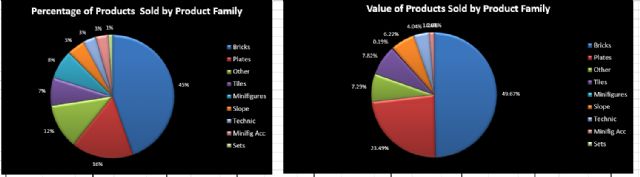
Edge is playing games with the images try this one.
|
|
|
|
| | | | | | | | | | | | | | | | | |
| | | | | | | | | | | Author: | SylvainLS | | Posted: | Oct 4, 2022 08:47 | | Subject: | Re: 11 Years worth of data now | | Viewed: | 53 times | | Topic: | General | |
|
| In General, calsbricks writes:
| | […]
Edge is playing games with the images try this one.
|
Something is weird indeed. Are you sure the titles are correct?
Because, as I read the charts, your bricks have more value than your sets: the
average value (value / qty) of your sets is 0.? / 1 (below 1) while the average
value of your bricks is 49.67 / 45 (greater than 1).
|
|
| | | | | | | | | | | | | | | | | | | | | |
| | | | | | | | | | | | | Author: | calsbricks | | Posted: | Oct 4, 2022 08:53 | | Subject: | Re: 11 Years worth of data now | | Viewed: | 60 times | | Topic: | General | |
|
| In General, SylvainLS writes:
| | In General, calsbricks writes:
| | […]
Edge is playing games with the images try this one.
|
Something is weird indeed. Are you sure the titles are correct?
Because, as I read the charts, your bricks have more value than your sets: the
average value (value / qty) of your sets is 0.? / 1 (below 1) while the average
value of your bricks is 49.67 / 45 (greater than 1).
|
We do not sell sets - only the odd polybag so our bricks, which are in the 100's
of thousands always have much greater value in sales than our sets.
IN other word the 2nd chart shows the % of sales value represented by each product
family. Bricks and plates are 1st and 2bd and so ob,
|
|
| | | | | | | | | | | | | | | | | | | | | | | | | |
| | | | | | | | | | | | | | | Author: | SylvainLS | | Posted: | Oct 4, 2022 09:14 | | Subject: | Re: 11 Years worth of data now | | Viewed: | 44 times | | Topic: | General | |
|
| In General, calsbricks writes:
| | […]
| | Something is weird indeed. Are you sure the titles are correct?
Because, as I read the charts, your bricks have more value than your sets: the
average value (value / qty) of your sets is 0.? / 1 (below 1) while the average
value of your bricks is 49.67 / 45 (greater than 1).
|
We do not sell sets - only the odd polybag so our bricks, which are in the 100's
of thousands always have much greater value in sales than our sets.
IN other word the 2nd chart shows the % of sales value represented by each product
family. Bricks and plates are 1st and 2bd and so ob,
|
Here’s my reasoning in more details:
The first chart says you’re selling 1% in sets in qty. If you sell 1,000,000
items, that means 10,000 sets sold.
The second chart says the sets account for less than 1% in value (not visible
on the chart, so say 0.s%). If the total value is 1,000,000 × X (where X is
the average value of one item), then the total value for sets is around s,000
× X.
That means that the average value of a set is s,000 x X / 10,000 = 0.s × X.
Same reasonning for bricks means the average value of a brick is 49.67/45 = 1.1
× X.
So the average price for a brick is way more than the average price for a set.
Doesn’t make sense.
The only way it makes sense is if by ‘value,’ you mean ‘profits’ or if the charts
are swapped .
If the charts are swapped, the average values would respectively be X / 0.s and
X / 1.1, making the average set more expensive than the average brick.
And the same applies to minifigs (8% qty, 4.04% value).
|
|
|
| | | | | | | | | | | | | | | | | | | | | | | | | | | | | |
| | | | | | | | | | | | | | | | | Author: | calsbricks | | Posted: | Oct 4, 2022 09:27 | | Subject: | Re: 11 Years worth of data now | | Viewed: | 40 times | | Topic: | General | |
|
| In General, SylvainLS writes:
| | In General, calsbricks writes:
| | […]
| | Something is weird indeed. Are you sure the titles are correct?
Because, as I read the charts, your bricks have more value than your sets: the
average value (value / qty) of your sets is 0.? / 1 (below 1) while the average
value of your bricks is 49.67 / 45 (greater than 1).
|
We do not sell sets - only the odd polybag so our bricks, which are in the 100's
of thousands always have much greater value in sales than our sets.
IN other word the 2nd chart shows the % of sales value represented by each product
family. Bricks and plates are 1st and 2bd and so ob,
|
Here’s my reasoning in more details:
The first chart says you’re selling 1% in sets in qty. If you sell 1,000,000
items, that means 10,000 sets sold.
|
Not really sure I agree with your analysis/interpretation. The first chart, to
us, shows the percentage of each family's sales against total sales. In other
words of all the items sold over 11 years Bricks makes up 45% of that total -using
your figures of 1,000,000 tptal items sold 0 bricks woul represent 450,000 of
those and so on. The 2nd chart says that if the total value of sakes is £2,000,000
the bricks would have been £980,000
Hope that is clearer. Makes perfect sense to us and the figures are quite accurate.
| |
The second chart says the sets account for less than 1% in value (not visible
on the chart, so say 0.s%). If the total value is 1,000,000 × X (where X is
the average value of one item), then the total value for sets is around s,000
× X.
That means that the average value of a set is s,000 x X / 10,000 = 0.s × X.
Same reasonning for bricks means the average value of a brick is 49.67/45 = 1.1
× X.
So the average price for a brick is way more than the average price for a set.
Doesn’t make sense.
The only way it makes sense is if by ‘value,’ you mean ‘profits’ or if the charts
are swapped .
If the charts are swapped, the average values would respectively be X / 0.s and
X / 1.1, making the average set more expensive than the average brick.
And the same applies to minifigs (8% qty, 4.04% value).
|
|
|
|
| | | | | | | | | | | | | | | | | | | | | | | | | | | | | | | | | |
| | | | | | | | | | | | | | | | | | | Author: | calsbricks | | Posted: | Oct 4, 2022 09:30 | | Subject: | Re: 11 Years worth of data now | | Viewed: | 34 times | | Topic: | General | |
|
| In General, calsbricks writes:
| | In General, SylvainLS writes:
| | In General, calsbricks writes:
| | […]
| | Something is weird indeed. Are you sure the titles are correct?
Because, as I read the charts, your bricks have more value than your sets: the
average value (value / qty) of your sets is 0.? / 1 (below 1) while the average
value of your bricks is 49.67 / 45 (greater than 1).
|
We do not sell sets - only the odd polybag so our bricks, which are in the 100's
of thousands always have much greater value in sales than our sets.
IN other word the 2nd chart shows the % of sales value represented by each product
family. Bricks and plates are 1st and 2bd and so ob,
|
Here’s my reasoning in more details:
The first chart says you’re selling 1% in sets in qty. If you sell 1,000,000
items, that means 10,000 sets sold.
|
Not really sure I agree with your analysis/interpretation. The first chart, to
us, shows the percentage of each family's sales against total sales. In other
words of all the items sold over 11 years Bricks makes up 45% of that total -using
your figures of 1,000,000 tptal items sold bricks would represent 450,000 of
those and so on. The 2nd chart says that if the total value of sales is £2,000,000
the bricks would have been £980,000
Hope that is clearer. Makes perfect sense to us and the figures are quite accurate.
| |
The second chart says the sets account for less than 1% in value (not visible
on the chart, so say 0.s%). If the total value is 1,000,000 × X (where X is
the average value of one item), then the total value for sets is around s,000
× X.
That means that the average value of a set is s,000 x X / 10,000 = 0.s × X.
Same reasonning for bricks means the average value of a brick is 49.67/45 = 1.1
× X.
So the average price for a brick is way more than the average price for a set.
Doesn’t make sense.
The only way it makes sense is if by ‘value,’ you mean ‘profits’ or if the charts
are swapped .
If the charts are swapped, the average values would respectively be X / 0.s and
X / 1.1, making the average set more expensive than the average brick.
And the same applies to minifigs (8% qty, 4.04% value).
|
|
|
|
|
| | | | | | | | | | | | | | | | | | | | | | | | | | | | | | | | | |
| | | | | | | | | | | | | | | | | | | Author: | SylvainLS | | Posted: | Oct 4, 2022 09:43 | | Subject: | Re: 11 Years worth of data now | | Viewed: | 41 times | | Topic: | General | |
|
| In General, calsbricks writes:
| | […]
Not really sure I agree with your analysis/interpretation. The first chart, to
us, shows the percentage of each family's sales against total sales. In other
words of all the items sold over 11 years Bricks makes up 45% of that total -using
your figures of 1,000,000 tptal items sold 0 bricks woul represent 450,000 of
those and so on. The 2nd chart says that if the total value of sakes is £2,000,000
the bricks would have been £980,000
|
That’s exactly how I interpret your charts 
But, using your numbers: 450,000 bricks for £980,000 means one brick is £2.27
on average.
Same reasoning with sets and it means you sold 10,000 sets and they represent
less than 1% of £2,000,000, so less than £20,000, so less than £2 per set on
average.
Same reasoning with minifigures and it means you sold 80,000 minifigures and
they represent 4% of £2,000,00, so £80,000, so £1 per minifigure on average.
Doesn’t make sense.
| | Hope that is clearer. Makes perfect sense to us and the figures are quite accurate.
|
|
|
|
| | | | | | | | | | | | | | | | | | | | | | | | | | | | | | | | | | | | | |
| | | | | | | | | | | | | | | | | | | | | Author: | calsbricks | | Posted: | Oct 4, 2022 10:04 | | Subject: | Re: 11 Years worth of data now | | Viewed: | 47 times | | Topic: | General | |
|
| In General, SylvainLS writes:
| | In General, calsbricks writes:
| | […]
Not really sure I agree with your analysis/interpretation. The first chart, to
us, shows the percentage of each family's sales against total sales. In other
words of all the items sold over 11 years Bricks makes up 45% of that total -using
your figures of 1,000,000 tptal items sold 0 bricks woul represent 450,000 of
those and so on. The 2nd chart says that if the total value of sakes is £2,000,000
the bricks would have been £980,000
|
That’s exactly how I interpret your charts
But, using your numbers: 450,000 bricks for £980,000 means one brick is £2.27
on average.
Same reasoning with sets and it means you sold 10,000 sets and they represent
less than 1% of £2,000,000, so less than £20,000, so less than £2 per set on
average.
Same reasoning with minifigures and it means you sold 80,000 minifigures and
they represent 4% of £2,000,00, so £80,000, so £1 per minifigure on average.
Doesn’t make sense.
| | Hope that is clearer. Makes perfect sense to us and the figures are quite accurate.
|
|
Understand what you are sayibg - will relook at actuals figures - hypothetical
figures do not make sense.
|
|
|
| | | | | | | | | | | | | | | | | | | | | | | | | | | | | |
| | | | | | | | | | | | | | | | | Author: | peregrinator | | Posted: | Oct 4, 2022 09:36 | | Subject: | Re: 11 Years worth of data now | | Viewed: | 35 times | | Topic: | General | |
|
| In General, SylvainLS writes:
| | So the average price for a brick is way more than the average price for a set.
Doesn’t make sense.
|
Maybe the average price of a lot of bricks (e.g. 500 red 3001s) is more
than that for a set.
|
|
| | | | | | | | | | | | | | | | | | | | | | | | | | | | | | | | | |
| | | | | | | | | | | | | | | | | | | Author: | calsbricks | | Posted: | Oct 4, 2022 09:39 | | Subject: | Re: 11 Years worth of data now | | Viewed: | 39 times | | Topic: | General | |
|
| In General, peregrinator writes:
| | In General, SylvainLS writes:
| | So the average price for a brick is way more than the average price for a set.
Doesn’t make sense.
|
Maybe the average price of a lot of bricks (e.g. 500 red 3001s) is more
than that for a set.
|
The average price of our sets is under £10 (Small polybags - nothing more really).
We get an odd one worth more than that but in the main we do not sell sets. We
are a oarts store - we leave sets to those who are into sets.
|
|
| | | | | |
| | | | | Author: | Sadler_Bricks | | Posted: | Oct 4, 2022 13:16 | | Subject: | Re: 11 Years worth of data now | | Viewed: | 29 times | | Topic: | General | |
|
| Very nice indeed. We dont use any 3rd party systems but we have created our own
system for data. Inventory builds etc. Its always fun to see the changes and
how the data builds. Anyways nice job.
Sadler_bricks
|
|
| | | | | |
| | | | | Author: | wildchicken13 | | Posted: | Oct 4, 2022 13:30 | | Subject: | Re: 11 Years worth of data now | | Viewed: | 38 times | | Topic: | General | |
|
| In General, calsbricks writes:
| | Anybody else produce data like this?
|
|
|
|
| | | | | | | | | |
| | | | | | | Author: | Nubs_Select | | Posted: | Oct 4, 2022 13:30 | | Subject: | Re: 11 Years worth of data now | | Viewed: | 39 times | | Topic: | General | |
|
|  |
|
| | | | | | | | | | | | | |
| | | | | | | | | Author: | wildchicken13 | | Posted: | Oct 4, 2022 13:38 | | Subject: | Re: 11 Years worth of data now | | Viewed: | 49 times | | Topic: | General | |
|
| In General, Nubs_Select writes:
Sorry, forgot to update. Should be:
|
|
|
| | | | | | | | | | | | | | | | | |
| | | | | | | | | | | Author: | SylvainLS | | Posted: | Oct 4, 2022 13:59 | | Subject: | Re: 11 Years worth of data now | | Viewed: | 43 times | | Topic: | General | |
|
| I tried making stats on my store… but my computer is broken, it only says ”NaN”
over and over 
I fear it’s shorthand for “Sorry, ̶D̶a̶v̶e̶ Sylvain, I can’t do that.”
|
|
| | | | | | | | | | | | | | | | | | | | | |
| | | | | | | | | | | | | Author: | Nubs_Select | | Posted: | Oct 4, 2022 14:02 | | Subject: | Re: 11 Years worth of data now | | Viewed: | 33 times | | Topic: | General | |
|
| In General, SylvainLS writes:
| | I tried making stats on my store… but my computer is broken, it only says ”NaN”
over and over
I fear it’s shorthand for “Sorry, ̶D̶a̶v̶e̶ Sylvain, I can’t do that.”
|
Hmm I wonder what ̺̺̺̺̺̺̺̺̺̺̺̺̺̺̺̺̺̺̺̺̺̺̺̺̺̺̺̺̺̺̺̺̺̺̺̺̺̺̺̺̺̺̺̺̺̺̺̺̺̺̺̺̺̺̺̺̺̺̺̺̺̺̺̺̺̺̺̺̺ͩͩͩͩͩͩͩͩͩͩͩͩͩͩͩͩͩͩͩͩͩͩͩͩͩͩͩͩͩͩͩͩͩͩͩͩͩͩͩͩͩͩͩͩͩͩͩͩͩ
language ̺̺̺̺̺̺̺̺̺̺̺̺̺̺̺̺̺̺̺̺̺̺̺̺̺̺̺̺̺̺̺̺̺̺̺̺̺̺̺̺̺̺̺̺̺̺̺̺̺̺̺̺̺̺̺̺̺̺̺̺̺̺̺̺̺̺̺̺̺ͩͩͩͩͩͩͩͩͩͩͩͩͩͩͩͩͩͩͩͩͩͩͩͩͩͩͩͩͩͩͩͩͩͩͩͩͩͩͩͩͩͩͩͩͩͩͩͩͩ
has weird line in the names like that ̺̺̺̺̺̺̺̺̺̺̺̺̺̺̺̺̺̺̺̺̺̺̺̺̺̺̺̺̺̺̺̺̺̺̺̺̺̺̺̺̺̺̺̺̺̺̺̺̺̺̺̺̺̺̺̺̺̺̺̺̺̺̺̺̺̺̺̺̺ͩͩͩͩͩͩͩͩͩͩͩͩͩͩͩͩͩͩͩͩͩͩͩͩͩͩͩͩͩͩͩͩͩͩͩͩͩͩͩͩͩͩͩͩͩͩͩͩͩ
|
|
|
| | | | | | | | | | | | | | | | | | | | | | | | | |
| | | | | | | | | | | | | | | Author: | Nubs_Select | | Posted: | Oct 4, 2022 14:03 | | Subject: | Re: 11 Years worth of data now | | Viewed: | 28 times | | Topic: | General | |
|
| In General, Nubs_Select writes:
| | In General, SylvainLS writes:
| | I tried making stats on my store… but my computer is broken, it only says ”NaN”
over and over
I fear it’s shorthand for “Sorry, ̶D̶a̶v̶e̶ Sylvain, I can’t do that.”
|
Hmm I wonder what ̺̺̺̺̺̺̺̺̺̺̺̺̺̺̺̺̺̺̺̺̺̺̺̺̺̺̺̺̺̺̺̺̺̺̺̺̺̺̺̺̺̺̺̺̺̺̺̺̺̺̺̺̺̺̺̺̺̺̺̺̺̺̺̺̺̺̺̺̺ͩͩͩͩͩͩͩͩͩͩͩͩͩͩͩͩͩͩͩͩͩͩͩͩͩͩͩͩͩͩͩͩͩͩͩͩͩͩͩͩͩͩͩͩͩͩͩͩͩ
language ̺̺̺̺̺̺̺̺̺̺̺̺̺̺̺̺̺̺̺̺̺̺̺̺̺̺̺̺̺̺̺̺̺̺̺̺̺̺̺̺̺̺̺̺̺̺̺̺̺̺̺̺̺̺̺̺̺̺̺̺̺̺̺̺̺̺̺̺̺ͩͩͩͩͩͩͩͩͩͩͩͩͩͩͩͩͩͩͩͩͩͩͩͩͩͩͩͩͩͩͩͩͩͩͩͩͩͩͩͩͩͩͩͩͩͩͩͩͩ
has weird line in the names like that ̺̺̺̺̺̺̺̺̺̺̺̺̺̺̺̺̺̺̺̺̺̺̺̺̺̺̺̺̺̺̺̺̺̺̺̺̺̺̺̺̺̺̺̺̺̺̺̺̺̺̺̺̺̺̺̺̺̺̺̺̺̺̺̺̺̺̺̺̺ͩͩͩͩͩͩͩͩͩͩͩͩͩͩͩͩͩͩͩͩͩͩͩͩͩͩͩͩͩͩͩͩͩͩͩͩͩͩͩͩͩͩͩͩͩͩͩͩͩ.̸̹̮͇̞͆̽͒̋̎̆͌̋͝.̷̤̘̇͂̓̾͒̀͒̌̓̚͝͝.̶̰͉̔͒͗͘͝͠.̶̩͈̼͉̱͎̤̱̝̏̀̎.̴̡̢̛̯̳̘͖̄̃̃͝ͅ.̷̧̫̬͖̯̣͈̟̑̎̔̐̈́̆͆͋̓͑̂͘͝.̷͈̤̭͉̞͇̲̥̏̌̀̂́͛.̵͈̗͔̠̼̮̟͉̖̖̣̘͋͑̽͛̑̑͛͗͝.̴͕̦̙̀̒̈͆͊͂̓̌͌̕͜.̶̡̨̳̝͓͚̲͇͖̥͓̄͂͆̀̏̑̒̃̄̽̿̍͘͝.̷̢̪͂͑̈̀̾̅̀̐̀̈́͛͂̍̕͝͠.̵̧̭̩̠͇̱̙͔̤̱̻̖̙͈̟̬͊̽̓̆̚.̵̦͎͚͍̍̈͂͑͂̓̌͘.̸̛̣̲͎͒̂̏͋͂͆͗̆̀̀̂͛.̶̢̡̗̥̳̪̖̯̪̥̯̤͇̜̻̟͊̔̀.̷̧̡̱͉̙̜̜̰̱͇͑͛͘͜.̸͙̰̮̦͇̬̞͓̰̗͋͑̀̎̍̍͆̌.̶̗͈̩̼͒.̴̨̦͙̝̜̻̹͙͙̻̓̈̽̉͑̆͆̚͘ͅ.̴̢̥̰̪̪̖͕̺̪̜͐̈́̋̐̒.̴̛̦̺̤͖͙̳̗̣̠̥̪̊̾͒̒̚.̵̢̯̞͔̗̗͖̞͎̉͊̾͆́̈́̾̌͝.̵̻͕̗͔͍̜͈͎͓͋̾́̍͑̀̈͠.̸̡͆̓̄͑̉̋.̷̛̫͙́͆̈́͗̈́̃̾͐͗͂̀̚͝.̷̪͖͚̹͈̝̦̫͇͇̞̈͆̄̃̏̈́̍̌͜͠.̵̭̲͕̪̭͓̖̯̬̮̫̺͐͐́̚͜.̵̡̡͍͓͍̥̝̼͕͈̥̘̰̭̻̥̄͛͂̆̽̊͂̄̓̀̃ͅ.̸̛͓̠͈̔̎̆̌̅͒̀̎́̆̃͝͠.̵̢̛̛̛̗̰̩͈̝̟̳̥͇͕̯̪̤̖͌͋̔͆͂̍͋͋̿̀̔͑͂͒͜.̸̛̣̜́͐̓̾̑́͝͠.̷̡̯̫̝͇̫̥̰̙̥̟̺̿̋̽́́̓̅͛̽̿͛͘͜͝.̴̗̪͈͎͎̠̞̍̇̌̃̈̆͛͗ͅ.̷̧̡̢̼̝̥̺̝̫̰͖̣̮̙͛̄̓̑̌͊̆̿.̴̘͖̙̺̭̦͍̬̼̘̮̫̬̫̑̈̏̓̔̔̐̃̂̿͛́͋͘ͅ.̷̛̮͙͇̜̣͕͚͉͈̪̇̃̄̊̂̏͐̒̒͐͂͜.̸̡̹̲̹̯͎̬̂̃̀͗̋͊͆̏̑͂̃̈́͘͘͝.̶̛̯̆̓͌̈̇͗͋͗̔̕͠.̶̲̟̈͑̄̉̏.̸̦͍͐́͊̾̐͌.̴͎̆̋̃͗̈́̍̂̋̋̅͐͗͒͆͜.̸̨̢̲͍͗̓̎̃͐̈́̿.̷̛̼̥̼̎̉̑̂͗̈̏̒͌͘.̵̡̧̧̨̳̜̱̼̺̯͕͍̭̰͉̳̃̈̀̑͂̄̌̉̏̅̓.̶̢̩̳͉͚̦͍̤̤̮̻̬̠̆͜.̵̧̧̹̼̩̜̖͇̜͓̟̼̪̝̣̈̾̈̽̈̀͌̂.̸̝̀̀̋̌̉͘.̸̢̛̛͉̺͖͎̙̳̰̦͈͔͚͇͇̞̺̎͑̅̽̈́̏́̀͑̌̄̃͠͠.̷̧̧̱̘͚͎̀͋̈́͗̿̋̋̈́̽̊́̊̔̕̕͠.̵̛͓̤͍̣͔̏̈̈͗̾̇̇͜͝͠.̷̧̨̬̗̺̒̇̑̊͐̍͆̽̇̀̐̓̕.̶̨͓̖̦̲̔̌̏͜.̶̧̢̧̢̛͍̥͕̯̜̣͖̰̺͇̔͑̀̅̒̈̓͆̑̇̕͝͠͝.̸̡͖̭̭̩̜̘͔͔̖̥̮̦̹̩͒̃̕.̸̯͖̯̱͉̻̣̹̙̮̰̊͑̒̔̀̀.̴̛̩̳̝̰̳̝̖̗͈͇̼͓̲̙͙̔̾̅͂͒͗̋̑͆̉̀̀̎͜͝͠͝.̴̩͋̅͐͆̾̚͘͘.̵̢͓̘̱͍͎̆͛̄̓̉͘͠.̷̡͙͖̩͓̳͚̼̱̫̊̍͋̎̓̌̌̃̇̊̌̀̓̓́͘.̷̧̢̬̪͔̬̤̞̥͇̣̠̣̟̇̾͌̽̍̇̋̿̄͑̚͝.̶͈̥̞̲̌̐̈̌́͊̀͗̎̾̈̈́͝͝.̷̰̫̲͚̿͆̅̎͒̋́̃̅̑͗̃̉͌̔̕.̷̛͓̮̮̱̬̞̄̇̔͋͛̋͛̆̓̔̇͆͋̎̚̕ͅ.̸̢̢̧̼̭̺̤̥̘͖̯̖͂̄̅͘ͅ.̸̡̨̛̛̫̪̝̻̻̙̙̟́̇̔̑̆̅́̌̇̀͘̚͜͝.̸̨̛̬̥̺̙̥͔͍̰̝͔̃̀̀͂̈͐́͒̓̚̕̕͝.̷̨͉̣̮̥̫̻̫̋̅.̵̦͔͉̈́̄̀͗̀̊͝͠͠.̵̡̛̦͍͚̪́͆̒͗̑̈̐̅͑͐̈̃͠.̴̡̫͚͖͓̺̥̹́͒̋͊͌͆͆̈́͑̕̕͜.̷̨̧̪͚̻̱̪͓̏͌̋̈́̊̈́̎̀́̏̏̏̋͠.̵̧̢̗͎̜̜̮̹͓̱̞̩̬̭̖̒́̌͛̒̿̂̿̅͛͌͋͒̔͗̕͘.̸̨̧͙̣͉̯̻̘͙̣̩̤̫̼̪̮̄̔͒̋͘͝.̵̢͍̭̫̤̜̲̩̤̻̈́͂͆͊̉̌͆͝.̷͇̳̱͔̝̲͕̣̹̦͉̭̑́́̏́̾͊̎̌̄̈́̋̕͝͝.̵̢̩̥͈̱̋͊̅͊̇́̒͠.̴̧̲͎͈̬̤̤͖̻̥̺̲͋͋͑̀̊̎͝.̸̨̛̝̫͔̖͒̅.̷̫͇̣͕̗̖̝͌́͛̋̈́͌̔̽̉͘͠ͅ.̸̢̥̜̮̩̝̰̳̤͔͐͋̉̓̋̒̈̎̅͋̐̾͘͠͝ͅͅ.̵̢̧̮̻͓̜̤̯̩̝̐̔̉.̵͈̟͈̬̤̻̮͕̈́̔̄̓͌͆͆̈͋̄̾̈́̓̉.̵̢̳̻̯̙̭̮̟̈̽.̸̡̯͚̺̣̤̰̗̰̥̯̥͉̲̻̔́͠͠.̴̧̧̭̱̖̀̓̀͌̑̇̀̈͗̀̕̚͘͠͝͝͠ͅ.̵̡͓̠͉͚̮̤̘̥̂̋́̋̔͂̀.̶̢̢̠̥̤͔̗͓̰̘͋́.̴̨̧̡͓̹̖̻̘̒́̍͝.̴̧̻̠̬̓̂̌̈́̄͋̾̀͗̕͠͝.̸̡͋̽̍̎͗̊͛̋̂̃̌͗͘.̴̫̺̰̗̗̠̣̫̺̲̰̆͆.̸̨̧̯̙̞̟͙̖̞͈̬͙̞̖͎͉̽̿̇̔̂̎͗͌͆́̕͝͠͝͝ͅ.̷͕́͛̈́.̸̝͛̇̊̈́.̴̧̥̹̫͙̟̘̩̮̘͖̜̱̥̟̬̃͑̆͆̿̑̓̏̕͜.̴̯̺̖͆͆̀.̶̧̡̨̻͓̣̜͙͕̦̱̪̒͛̅̕.̶̨̡̡͓͚̺̟̹͍̲͉̬͚̼̮̬̈́́̊͗͗̃ͅ.̵͓̲̰̼̫̹̖̩̙̇̊͘.̸͎̝͓͖̜͙͎̲̝͇̺͉̳̘̱̹̟̾͋̅̓́̐͊͝͠.̸͕̆̾̆͘.̶̞͎͚͐̈́͌̅̾̈́̇̎̉̂̎͋̆̾͝͝ͅ.̸̧̛͈̰̹̭̪͉̣͔͐͗̔̑̾̇̿̉̐͝͝.̷͈̞̞̄̌̒̅̅.̵̛͚͈̼͈̺̠̘̝̖̗̰̼̈́.̶̮̚.̶̧̦̼̱͙̥̲̝̥̭͍̪̈́̍͌̋͑͒̒̅͂͒̀̊̓̕͠.̴̛̰̯͚͚̳͍̞̯̯͊̒͂̌̃̎̒̐̅͗́̂͠͝.̶͕̻̠̱̙̟͐.̸̜̀͊̀̒̾̐̔͑̚̕͠.̴̱͎̻͕̳͖̲̙͔̹͇̮̐̆͆͒̍̾̂̍.̶̻̼͕͎͕̹͔̤̖͆̅͑̏͛͒̾̂͘͝͠.̶̦̘̥̹͍̍̄̓̀̈́̑́͒̋̓̂͝.̷̧̧̭̬̦̩͚̫̈́͜͜ͅ.̶̨̧͔̳͔̖̗̱̦͔̫̝͙͓̝̉͒̌̀́.̸̡̡̛̠̮̼̜̹̗̝̗͎͚͔̂̓̂̿̈̃̓͗̆̇̐̀̎̓͝͝.̸̧̛͚̞̩̣͎̭͑́͋̃̑̽̀̆͋͛͛̌̄̚̚.̷͈̤̈́̀̀͆́̒̔̅̽̐̀.̸̢̢̹͎͓͓̘̬̝̼̦̠͚̽̊̍͊͌̏͜͜͜.̵̞̽̎̃̊͠.̵̨̼͙̬͚̩̠͇̽̿̃̇̈́́̔͗͝͝͝.̷̢͉͚͙̣̎̓̒̕͝͠.̶̡̲̹͎̟̰̝͒͐͌̚͠.̶̡͙̘̆̍̆̅͒̆̓.̷̡͒̃͋̊́̇͑́͘.̷̧̡̛̘̩̝̤̺̮̬̹͙̺͎̯͔̱̔͐̅͗̎͗̄̍͝.̷̡̬̮͖͕̤̺̯̠̝̯̮͐̇̆̍̄̕.̷̢͚̦͌̎̇͌̋̋̇̿̈͊͝.̴̨͔̥̺͖͙͔͉̙͎̂̏̂͐̆̈́̀̅́̔̍̈́͜ͅ.̷̘̪͖͙̥̲͚̻̙͈͎͎͍̰͑̃̐͑̕̕.̶̢̡̧͈̪̯̗̫̣̮̟̦̩͔̘̊͋̄̀.̵̧̨̡̨̡̡̻͍̘̥̟͖̩̯͍̎̋̂̀̆́̈́̇̊͂̔̃̈̾̚͝ͅ.̸̛̣̯̒͐̃̄̈́́̎̏̿̿̈́́.̵̡̧̪̪̭̜̯̩͙̗̟͑̿̋͗͝.̵̨̥̫͙̣̞̝͓̬̬̗̀̊̌͆.̶̛͉̭̙̟̤͋̏̏̏̂͒̔͜.̴̛͚̩̩̝͚͔̜̘͖̭̈̿͆̏̐̾́͗̎.̸̡̛͉̹̹̖̓̈́̍͊̄̓̉̑͋̇̂̀̆̚͜.̶̡̛͉̱̩͈̈́̾̋̌̂̒͜ͅ.̶̨̣̫̼̺͕̙̗̪͛͐̈́̌̿͑͘.̵̧̹̳̠͕̭̩͈̝̻̹̅͜ͅ.̸̘͚̱̺̖̩́̄̈́̚.̸͚̺̱͚̲̑̌̎̀̎͛͜.̵̡̨̖̖̣̫͇̥̫͔̘̣͇̼̓̆͒̉͒͒͑͐.̶̡̢̻̹͖͚̯̀̿͑̽̕̚͝͝͝͝.̷͇̮̃̒̈́͛͆̆̂͋̈̑̏̉͘.̴̡̰͕̹͍̳̗̹̳̦̮̰̠͈̀̄̂ͅ.̶̢̩͍̭͍̮͕̭͉̱̺̪͂̽͗̾̆͋̀̀̏̍ͅ.̵̡̞̪̱̫̺̇.̶͇̹͖͇̙̬̳̥̩͙̞̮͐͌͋̓̈́͑̍̑͊̅̅̀͋̚͜͜͝͝.̴̧̰̻͉̹̙̻̬̯̀̅.̶̦͎̜͚̱̥̱̹͔̓́͋̅̅͛̀̋́̃̿̽̑.̴̣̝̈́̀́̓͒̌͝͝.̶̧̨̗͕͖̙͖̰̰̥̲͎͚̙̦̥͊̂̏̉̈́̓̓̓̚͝͠͝.̶̢̙̺̖͔̱͎̳̭̖̗̲̻̪̻͑̌͒̊̃̈̾̿̓̅̐́̀̋̔̏.̴̺͖͎͚̠̱̤͂̈́͜.̵̡̡͖̪̱̼͕̘̣̠̮̫͓̯͖̜̚͝͝͝.̸̧̢̨͍̗̬̯̻̣͊͐͋̔͂̀͒̃̓͌̓̈͊̾.̴̝̳̳̍.̶̧̛̯̻̺̳̙̟͇̜̟̥̍̈́͗̑̏͂̈́̊͂͂̒̐͂̈́̕.̴̤͉̿̂̉̉̎͑̀̈́̇̓͝͠.̷̛̟͚͇͙̹̤̩̋̂̔̈̾͝ͅ.̴̳͎͖̝̱͔̫̣̺̲̰̥̭̈́.̸̛͍̼͉̙̬̠͍̖͔̬̤̻̞̱̈́̀̃́͛͌̍̋̾̇́͘͜͠͠ͅ.̵̡̖̹̩̼̞̺͍͚͙̦̓̓̆̍͋̽͛͜͝.̵̨̢̞̟͍̝͕͆̊̋̊̅͆͐̽̽̕̚̚ͅ.̷̧̨̥̦̥̱͉̼̗̰̪͍̱͎̑̾.̸̇͑̇͊̅̎ͅ.̴̧̨̰̯̪̟͚͍́̓̆̍͜͝.̷̖̗̺̗̗̭̱̳͙̞̰̓͐́͘ͅ.̷̖̞͈̙̮͕̥͓̗̺̺̘̻̫̯̺̗̿̄̀̃̋͒̏̒͊̋͗̽̆͝.̷̧͈̭̲̱̹͙̪̘̲̒͗̑̅͑́̋̚͝.̷͎̱̝̏̒͂̄́͒͌̽͑̎̏́̉̃̌.̵̛͖̭̇̓͐̋̈́̈́͛̕͘͘.̶̧̭̝̭͇͓͓̩̥̬̑́͋̀̏̒͆̏͗͌̊̔̉͐̅͜.̴̨̧͓͈̼̖̻̪͍̙̘̦͕̞̟̆̑̾̏͂̑͑̕͠͝.̷̡͇͚̗̲̦̣̙̦̟̪̼̼̞̯̲͎̃̅͗̽̒̓̚͠͝.̶̛͓̮͈̘̤̞̗̼̤̰̯̏̑̊̓̏̎̾̏̀͘͜͠͝͠.̸̨͔͉̃̈͊̔̉̒̀̿͘͝.̷̻͋̂̎̈́̇̑̎͑̃̃̒̔͘͠͝.̵̘̟̮̞̻̫͆̾̌̓͂̆́̐̎̕.̵̦̤̺̗͚͎͚̭̞̥́̂̓̄̃̅̾̂̔͛̄̌̄̕͝͠͝ͅ.̸̧̨̺̟̺̬́̇̀͐͐̉̑͐̃͜.̷̢̛̛͓̹̳͖̪̹̹̗̖̩̮̼̳̤̗͛̈́̈́͛̑̊͛̃͛̃̋̽́̑̍͜.̸̡̨̛̼̳̘͍͓̤̬̩̫̦̮̥̲͇̺̓͌̎̀́͑̋.̵͚̬̊́̈̆͐͂̀͒͊͊̓̈̕.̵̢̡̦̪̯͉͈͇̻̙͙̻̳̋͜.̸̲͍̞͕̣̯̤͙̮͖̎͑͋̉̾͘͘͜.̴̛̦̻̻̞͈̫̼͇̜̪̯̟̀̌̄́̾̓̓̈́̃̾̉̄̍͂̓͝ͅ.̴̢̠̮͍̩͎̪͚̳̲̟̫̯͉̥̯͛͛̋̓̐́̆̃͐̉̿̕͜͝.̶̠͍̼͇͎̰̳͎̦̀͜.̷̡̛̫̳̬̤̲̫̼̗̤̓͂̑̐̆̾͊͜.̶̜͚̘̘̻̳̝̭̘̣̞͖̤̮̊.̵̱̹̲̄̾̕͝.̶̧̧̨̡̼͚͓͓̖͋̉̃̂̾̏̊̋.̶̢̝̱͑̽̓̅̊̅̃.̸̨̖͕̰͙̦̝͔̝̣͈̱̟̹͎̈̾͒̐̄̎̋͜͝.̷̧̘̘̠̭͓̥̼̤̮̮͈̞̭̥̄̄́̈́͂̓̂͘̚.̴̬̍̄ͅ.̸̱͈̥̩̱̣̯͑̿͋̄̅.̶̩̺̪̬̯̲̙̻̠̯̙̝̯̱̾̑͗̓́̂̒̏̃̏̀̕͝ͅ.̷̢̞̌͊̍̅̾͜͜.̶̡̢̛̻̔́͑́̔.̷̡̟̩͓̏̋̍̽̄͛̈́͂͝.̴̨̧̢̙̞͙̙̖͈͍̱̮̙̈́̽͆̇͗̿̎̉̏̚̚͝.̶̡̨̟̲͔̙̖́̓͑̀̚͜.̶͚̙̟͓́̒̽̽̈́͐̋̌͊̋̂̐́͛͆̏̕.̴̮̟̫̻͍̱̈́́̓̀̉͆̀̆͠.̶̧̢̨͙̭͔̠̝͓̠͔̩̼̳͖̎̈́̔͂̃̌͜͜͝.̵̨̛̳͉̗̟̝̭̣̳̘̠̾͒͋̐̎̋͘͝ͅ.̸̡̡̛͉̯̱̖̫̺̮͙̱̩̄̀͊́̒̓͊̀͐̚̕ͅ.̶̠̞̺̲̘͇͖̻̪͉̥͆́͐̈́.̶̢̪̘̼̥̗̻͖̣͓̳̈̿.̴̡̧̪̘̥̫͙̫̖̫̪̮͎̊̐̓̿͒̑̇̌͐̽̕̚̚͜͜͜͝͠͝ͅ.̶̢̩̐̃͑͊̓̂̔̓̂̇͂.̴̹͎̦̘͇͎̩̮̻̾͛̐ͅ.̴̙̭̺̘̼̤͙͇̹̹͕̟̲̅̎̍́͌͗̈̂͊̓̿.̴̢̟̩̗͊.̷̧̫͙̤̗͇̔̂̀̄͗̍̈͋̈́̕.̷̨̛͈̤͈̲̥̱̹̲͖͗͛͆̓͊̅̈̕͠.̸͕͎̺̤͔̬͙̆̈́̾͆͛̾̃̀̂͛̕.̶͍̓̓͆̎͝.̵̧̘̗̦͔̬̟͎̔͐́̿͛̐͋̓̾̃̍̕͘̕͜͝͝.̷̻̺͔͍̭͋̾̐̔͑̔̌̂͛͆̽͘͜͠͝͠.̷̧̨͉̝̳̲̫̙̻͎̬͚̒̀̄͒.̶̨͙̩̦̪͋̄͆͌̈́́͐̈̈́̕ͅ.̸̡̠̙̪͔͍̬̘̖̗̙̞̬͇̐͋͊͐̋̚ͅ.̷̢̮̮̖̹̟̖̩̗͙̝̺́̑̈̉͘͘͠ͅ.̴̨̡̧̤̳͖̰̼̺̮͉͖̲̫̳̜̹̄.̵̢̤̦̞͙̝̬͍̞̤͇̽̾̈́̔̋̋̓̌̋̐̓̅͜͝.̷͙͊.̵̠̜̞̭̘͉͓̞̤͍̝̈́̋̃́̈́͐̃̉͆̚͜.̴͉͈͓͈͉͎̺͍͕̥̦̙͙͕̈́̏̿́̏̔.̶͕̟̤͔͑̉̽̓̇̐́̃̿͜.̶̧̨̨̱̪̞̞̯̹̤̘̭̠͓̀̓̐̓́͑͂̉.̴̛̙̮͚̊͗̏̈́͗̅͆̑̂̌̐̃̊̂̓.̴̙͎̻̔͑̿͗̃̒́̏̏͑͘̕.̷̧̧̱̦̣͈̟̠̦͔͓̮̈́̀̊̈̌̓̊͋̂͊̈́͋̕͘.̶̛̫̖͌͌́̔͂́̓̊͒͂̀͐͘.̴̢͙͙̫͌̀͋̔.̷̡̧̢͈̗͓̤̗͉̲̭̝̊̈́̍̿͊͂̓̈́.̵̟̲͎̤͍͇͚̺͑̀̂͑͋́͋͝.̷̧̡̢̙͖̙͉͍͈̤̼͔̮̈̊͒̒̍͊͒̀͋͌̀ͅ.̵̥̰̲̗̫̘̮̝̹̣̱͈̾͜͜ͅ.̸̡̻̗̩̏̄̇̿͑́̇̽̆́̊̈́̚͜.̶̢̨̨̙̺̬̉̿͝.̴̘̙̗̞͙͔͓͈̦̉̀̽̐̅̈́̍̉̚ͅ.̵̡̢̢̛̳̪̼̗̦̬̳̤̻̥͍̈́́̌̈́́̌̈́́́̄̋̈́.̸͈͙̘͙͈̯̱̠͓͙͌̑͛̈́̾̉̋͆̓̎̓͝͝.̶̘̱̞͕̟̺̜̟̻͚̤̲͍̟̄.̴̨̗̻̜͇̹͙̘́̊͛̏̊̂̈́̿̅̔́͑͜.̴͇̲̦̖̓͊̈̈̎̂̊̆̈́̽̈́ͅ.̴̧̨̢͔̩̪̠͓̤̥͇̯̲͎̺͑͑͋̇͗̂̐̈́̋͌̈́͊͊̕͘͠.̷̛̫̤͉́̈̅̓̀.̸̧̡̪͍̱̱̼̈́́͜.̶̨̡̖̱̳̘͔͈͚̟̝̎́̈́͜ͅ.̶̢̛͈̭̹͓̰̆̓̎́̍͋̋̈́̇̎̓̊͠.̵̦̣͗̿̿̈́.̶̲̗̠̤̰̯̫̮̘͖̦͎͗̂.̵̲̯̮̺͕̳̀̊͗̿̂̒͋́̆̓.̴̲͗̊.̵̡̬̣̱̱͂͑̀̄̓̈́͛̕̚.̴̛̼̭̠̣͌͑͐̀̂̃̿̃̉̕̚͝ͅ.̷̨̬͈̖̪̲̘͉͓̮̥̤̲̥̙͖͂͊̔̃͛͝.̴̢̛͕̰̲̬͉͉͇̜͓̼͕̠̝͚̋̌̈́.̶̡̧̛͙͓̱̭̳̖͕̣̯̈́͆̌̈́̈̇́͆̉̃́̓̉̐̆͘.̷̡̡͔̥̲͔̱͓͍͔͓̠͕̰̤͆̈́͆̿̌̆̀̏͋̽̇͜.̷̧̠̯͈͈̫̉̒͜.̴̧̧̢̭̣̯̻͇̼̖̣͚͔̭̝̉̍͐͐̔͂̿͗ͅ.̷͉̂͒͐̌̄͑̐̿̏͂̃̑̿̉.̵̢̡̛̼͈͌̌́̊̆̌͜.̵͔̹̫̱̻̣̫͈̪̺̺̘̩̺̞̓̈́͗͊.̴̧̨̢̜̯̯̜̠̣̣͓͚͔̼̲̋̂.̸̢̢̛͖̣̠̣̘̃͒̓ͅ.̴̢̩̤̟̜̞͍͉̺̐̇̒͐̏̍̈́̈́̕̚.̷̥̗̞̓̏́̒̃̄͒͠.̴̦̟̳̤̜͚̱̥̠͎̩̖̤̒͋̐́̈́̈͘͝.̷͎͚̦̼̪̰̤̭͚̈́̇͝.̶̛͖͈͖̯̥̩̙̫̲͎͇̘͚̻͈̩͗̍̐́̇̋̊̒͒̔̇̕̚͝ͅ.̷̛̤̣̣̳̯͍̿͒̌͑͌́̌́̽͊͗̉̚͠.̸̗̇̋̔̆̈́̈́͑̐͋̃̕͘͠͝.̵͖̞̫̤̮̥̙͈̠̓͂͋̐̐̿̾̆̆̀̈̚͘͜͠.̸̭̝̖̘͓̜̱̤̭̝̟̳͔͕́͑̀̃̑̓͒̉͌̎́̈́̄̊̋̉̚.̷͚̺̑́̀̀̈͜͠.̸̢̱̹͖͇̀̀̍͑.̶̣̝͙̰̮̈́͑́̃̔͋̔̓̽̓̅͌̀͑͗͝.̶̧̜̖͛͌̑̆̒̓͆͝ͅ.̴̢̨̗͔̤̯̹͍̖̟̟̤̳̰̮̤̾͗̏̀̓̾͝.̶̧̛̬̙̘̫͕̬̤̖̙͖̑͛̏͂̋͒́̽̿̓̇̄̚̕͜͜.̶̢̩̭̲̱̂͛̌͠ͅ.̴̨̻̼͙̤̀̈́̍̋̽̆̎̉͗͜͝.̵̬͈̰̹̥͌͜.̶̘̖͓̟̟͔̭̳͖̜͍̭̮̠̍͜ͅ.̵̧̡̙̩̠̬͍̱̱͑̽͑̓̅̂.̴̢̧̙̗͍̱̹̯̰́͌̐̎̈́̀͗͊̂̓͌̕͝͠͠.̸̻̞͔̠̀.̵̲͕̎̆̍̔͌̈́͛̄̑̇̆̕.̶̧̞̱̠̤̞͇̰̩̮̈͋̑́̔̀͒̀̒́̍̊͝.̷̢̤͕̈͆̓̑̉͐̂̕͝.̸̢͕̩͈̤̱̞̍͂̂̀̾͂̋͠ͅ.̴̞̝̾̂̓͛̿̍̐͋̄̕͠.̵̧͙̞̣̱̭̯̌.̸̨̧̛̱͕̮̘̞̠͇̲̙̈́̍͗̍͐͂̀͜ͅ.̶̢̳̱͚̞͌̆͊̆̅̃̾͊͘͜.̴̝̌̄̅̅͗.̸̧̺̩̮̙̞͉̱̤̑.̷̡̳͖͕̲͇̳̳͉̘͓̳̹̠̎̇͜͠͝.̵̙̝̲̭͔̦͙̥̦̈́̏̒̎͂̿̐̊̍̎̄̕̚̚͜͝͝.̴̤̬̯̲̺̻͍̞͍̩̓͊͆̍̾̊̅̋͛͗̂͜͜͝͝͝.̴̧̥̥̫͔̱̗̲̥̳̭̯̜̝͖̝̄̌̊̂́̎.̶̡̛̳̹̬̝̖̤̖͕̦̲̪̬̥̙͕̩͐͋̓̂̔̂̋̀.̸̯̰͚̖̙̣̦̱̜̖͓̬̬̀̄̈̆̌̃̽͜͜͜͝ͅ.̵̨̜͉̹̄̑͛̇.̸̻̙̦̝̩̏̔̓́̽͑͋.̶̛̛̩̣̟͙̳͉̦̩̣͙̔͑̋̎̃̾̿͋͑̔͘͘͝͝.̴͎͕̙͓̊̔.̵̨̪̱̘͔̲͙̘͇͕̞̺̪̩̞̖̋̅̃͛̈̀͐̓̂̓̓́̽̚.̶̢̢̫̤̩̠̝̥̗̜̭̩̹̎̈̀͐̽̓̅́́̆͘̚.̴̟͉͚̤͈̰̰̫̼͇̰̻̳̼͙̹̲̽̓̏͋̃̈́̏̑͋.̶̢̛̞̣̭͚̖̤̳̪͚͙̳̺̹͎̟̽̄͆̈́̈̂̑̾̀͊̕͝.̷̢̨̧͙͍͍̯͚͉͖͖͓̘͎͑̿͋͌̓̓̄̓̈͌̀̕̕̚͠.̶̧̡̦͎̝͖̣͉̗̥̜̻̼̳̐̈͗̐̍̈̎̍̒̚.̵̡̨̯̮̜̼̣̫̰̞͇̼̇.̴̨̦͖̻̰̳͓̽̉̓͌͑̂̓̌͗́́̕͝͝.̵̧̢̻̹̣̠̰̞̫̣̤̓́͊̈́̀̈̋͌͛̓͋͆͌͘͜͝.̶̛͉̦̱͓͍̞̤͉̿̑́̾̾̀̊̽̂̊̈̓́̽.̶̬̻̻̳͈̤̰̠̫͕̈̾̎́͋͑͋́͂̔͒̿̓̕͘͜͜͠͝.̵̧̡̧̧͇̲̜̟̘͔̪͎̪̟̺͂̈́͊̉̂͊͋̾͐̈́͘͜͠͝͠.̴̜̻̥̤̠̭̩̤̖͕̉̀̈́͗̈́̀̉͝.̶͉͎̺͚̰͇̯̹̯̄͌͋͌̓̓͊́̎̕͘.̴̲̈́̅̏̋͛͝.̵̡̜̩́̽̾̌͆̊̿̍̇̕͠͝͝.̵͎̙̩͇̦̜̗̠̪͊̈͆.̸̻̹̝͉̥͇̼̐.̷̢̡̮̯̺̦͉̣̫̽̋͆͘.̴̧̡̧̧̡̞̟͍̟̞͙̹̪̞̍ͅ.̶̨̨̧̧̹̮̦̲̻͒̍̄͊̔͐͠͠.̵̨̺̱̩̭̟̣̻͍͓̲̦͉̥̈́̓͂͒̑̐̄͑̓͒̽ͅ.̷̙̙̄̅̋͋̋͛̈́̅͛̂͂̄͛́.̸̛̣̞͈͉̭͓̱͇̀͆͒̀̅̎̋̊̓̃̈̇̀͘.̵̞̤͉̹̙̺̠̺͗͐́̈́̎͛̓̈́͗͠ͅ.̶̡̥͓͕̗̖̩̮̣̬͔̦͍͚̋́̀̈̍́͛͑̂͑͘̕.̷̧̡̨̙̼̖͎̫̟̟̳̑͊͜ͅ.̴̛͈̖̞̖̲̻̦̼̘̦͕̱͓̬͋̈̾̈́̈́̏̈́̿̐̑͗̕͘͝͠.̸̨̧̼͖̮̙̰͍͓͊́́ͅ.̷̧̛̪̬̞̹̲͕͙͓̼̪̞̉̈́͆̈̕.̸̥̰̼͇͈̫͍͓̲̜͓͙̾̌̀͋̕.̶̡̧̨̰̜̫̙͓͈̗͔̥͙̝̙̝̺́̅͗̐̽̓͐̋̕͝.̷̢̗̩̗̣̥̍ͅ.̷̧̡̹͇̤̻̖̞̙͇̈́̕.̵̡̭͚̼͓̹̪̊̇̐̉̊̐͗̃̂̿͐͆̀͠͝.̸̨̧̤͙͕̦̪̠̯̳̝͇͍̆̀̊̈́̊̌́.̵̛͕͉̯̟͑̋̓̈̐͗̒̓̊̉͘͘͝.̶̢̖̣͎̫̘͙̦̲̞̝͓̫̰̌̿̀͌̂̂͐̉́̇͗̍̕.̵̡͍͙̎̄̆̓.̵̧̧̢̘̞̺͛͑̈́́̊̓̌̐̇̄̓̈̆̚͝ͅ.̶̻͎̪̭̭͎̞̽̇͜.̷͙̂̌͋̓̈́͊̓̽͊̇͘͜.̷̧̛̯̜̫̦̥͔̘̩͎̮̠͔̟͖̎̈́̐́̀́̐̆.̷̢͚̗̺̠̻̭̦̩̓̀̋́͊̑̌̉͐͗.̶̠̣͕͎̹̮̰̺͕̼̍͒̅͆́́̊̚̚.̸̨̨̘̫̳̙͇̖̘̝̥̲̦͔͎̺̈́ͅ.̸̧̨̛̙͔͉͈͔̞̙̰̰̯̭͋̒̔́̓͘.̶̻͆͐.̷̡̛͍̬̰͒͌̀́̋͂̓͘͜͝͝.̴̜̬̣̭̙̠̟͚͔͚̜̬͇̣͖̦̊̽͆̑̎͐͂͜͠͝.̵̡̨̠͉̘͈͉̱̘͔͚̪̈́̆.̵͕͇̃̈́̉̈̈́̿̈́͑͐̈́̚͝.̷̨̢̧̨̛̪̦̳͇̖̗̪͋̅͑̅͊͒͂̅͛̎͌͂̚̚̚͠.̶̬̟̬̗̗͙̘͖̱̲̼̣̲̓͑̄̾͊͆̅́̄̆̒.̴͙̲͓̻̔̒̀͊̆̋̓̓̃̊̆̓.̷̢̛̯̻͔͔̺̤̦̹̩̳͈͖̠͎̳͎̍̒͐̀̏͝.̸̹̳̒͒̂̀̽͒̅.̶͔̻͙͔̖̘̪̖͈̼̼̦͓͙͚̰̂͗̍͆̓͐́͒̈́̔̎͆̀̈̒̓͜.̵̺̝͕̜̭̤̳̙̰̬̐̾̋̃̇͛̀͘͝͝.̶̨̤͚̗͓̣͕͕̘͇̬̞̈́̂̇́̾͛͌́͌̽̚͜͠.̶̨̧̬͙͉̣͕̩͍̟̰̯̝̭̥̞̀̑̀͊͝.̶̛̘̮̳̥͓̞̬͕̺͎̘͎̏̐͐̈́̓͂̔̔͘͜͜͝.̴̡̢̠͓̳̱̠͙̀̇͑̊̊.̵̛̮̀̆͒̄̒̈́̃́̚.̷̻͕̮̥̼̲̘͍̱̼̥͛̔̓̒̾͐.̸̗̘̻͈͉̥̟͓͇̪͉̗̞̏̂͑̉͋̊̿̾̄͊̂́͝͝͝͝͝.̸͔̰̘͕̆̿́͋̆̈̌͆̒͋͜͝.̵̦͉̞̣͉̩͈̪̀̇͊͐͒̑̆̓̒̚.̶̨̻̪̻̱̲̫̦̯̫̥͈̓̏̾̇̾.̴̤͓̠͕̘̣̀͒͒̐̔̓.̷͓̖̤̬̱͚̪͍͉̠̼͂̀͛̈̿̐͐͝͝
|
|
|
|
| | | | | | | | | | | | | | | | | | | | | | | | | |
| | | | | | | | | | | | | | | Author: | SylvainLS | | Posted: | Oct 4, 2022 14:09 | | Subject: | Re: 11 Years worth of data now | | Viewed: | 34 times | | Topic: | General | |
|
| In General, Nubs_Select writes:
| |
Hmm I wonder what language has weird line in the names like that
|
It’s just U0336, the strikethrough character. Now, stop breaking the forum.
|
|
| | | | | | | | | | | | | | | | | | | | | | | | | | | | | |
| | | | | | | | | | | | | | | | | Author: | Nubs_Select | | Posted: | Oct 4, 2022 14:12 | | Subject: | Re: 11 Years worth of data now | | Viewed: | 32 times | | Topic: | General | |
|
| In General, SylvainLS writes:
| | In General, Nubs_Select writes:
| |
Hmm I wonder what language has weird line in the names like that
|
It’s just U0336, the strikethrough character. Now, stop breaking the forum.
|
|
|
| | | | | | | | | | | | | | | | | | | | | |
| | | | | | | | | | | | | Author: | wildchicken13 | | Posted: | Oct 4, 2022 18:06 | | Subject: | Re: 11 Years worth of data now | | Viewed: | 45 times | | Topic: | General | |
|
| In General, SylvainLS writes:
| | I tried making stats on my store… but my computer is broken, it only says ”NaN”
over and over
I fear it’s shorthand for “Sorry, ̶D̶a̶v̶e̶ Sylvain, I can’t do that.”
|
Maybe you should try asking on the discussion forum how to get more sales
|
|
| | | | | | | | | | | | | | | | | | | | | |
| | | | | | | | | | | | | Author: | calsbricks | | Posted: | Oct 5, 2022 03:19 | | Subject: | Re: 11 Years worth of data now | | Viewed: | 44 times | | Topic: | General | |
|
| In General, SylvainLS writes:
| | I tried making stats on my store… but my computer is broken, it only says ”NaN”
over and over
I fear it’s shorthand for “Sorry, ̶D̶a̶v̶e̶ Sylvain, I can’t do that.”
|
Gone through the figures with a fine tooth comb and they are 100% correct. Ours
are actual -
yours are hypothetical and the correlation is somewhat vague.
Remember chart 1 is based on no of total units broken down into those families
whilst chart 2 is based on total value again, broken down by family. There really
is no correlation between the two only to show that bricks are selling more and
bringing in more money than any of the other families.
|
|
| | | | | | | | | | | | | | | | | | | | | | | | | |
| | | | | | | | | | | | | | | Author: | wildchicken13 | | Posted: | Oct 5, 2022 12:01 | | Subject: | Re: 11 Years worth of data now | | Viewed: | 25 times | | Topic: | General | |
|
| In General, calsbricks writes:
| | Gone through the figures with a fine tooth comb and they are 100% correct. Ours
are actual -
yours are hypothetical and the correlation is somewhat vague.
Remember chart 1 is based on no of total units broken down into those families
whilst chart 2 is based on total value again, broken down by family. There really
is no correlation between the two only to show that bricks are selling more and
bringing in more money than any of the other families.
|
But Sylvain is talking about averages rather than totals.
Let's put it this way: Bricks make up a greater proportion of your sales
by value than they do by quantity. However, sets make up a smaller proportion
of your sales by value than they do by quantity. Therefore, the average sale
value of a single brick is greater than the average sale value of a single set.
Let's do the maths: At the time of writing, you've 183,047 bricks for
sale, for a total value of £12,465.97. That's an average price of approximately
£0.07 per brick. Meanwhile, you've 150 sets for sale, for a total value of
£1,639.99. That's an average price of approximately £10.93 per set.
Even when lots are considered instead of quantity, sets are still worth more.
Now, I realize there may be a bit of a survivorship bias here: The items for
sale in your store, are items that have not sold, not items that have. But I'm
skeptical that a single brick is worth more than a single set, unless you've
sold several hundred of these:
And even then, this item is technically categorized as a gear, not a brick.
|
|
|
| | | | | | | | | | | | | | | | | | | | | | | | | | | | | |
| | | | | | | | | | | | | | | | | Author: | calsbricks | | Posted: | Oct 5, 2022 12:26 | | Subject: | Re: 11 Years worth of data now | | Viewed: | 30 times | | Topic: | General | |
|
| In General, wildchicken13 writes:
| | In General, calsbricks writes:
| | Gone through the figures with a fine tooth comb and they are 100% correct. Ours
are actual -
yours are hypothetical and the correlation is somewhat vague.
Remember chart 1 is based on no of total units broken down into those families
whilst chart 2 is based on total value again, broken down by family. There really
is no correlation between the two only to show that bricks are selling more and
bringing in more money than any of the other families.
|
But Sylvain is talking about averages rather than totals.
Let's put it this way: Bricks make up a greater proportion of your sales
by value than they do by quantity. However, sets make up a smaller proportion
of your sales by value than they do by quantity. Therefore, the average sale
value of a single brick is greater than the average sale value of a single set.
Let's do the maths: At the time of writing, you've 183,047 bricks for
sale, for a total value of £12,465.97. That's an average price of approximately
£0.07 per brick. Meanwhile, you've 150 sets for sale, for a total value of
£1,639.99. That's an average price of approximately £10.93 per set.
Even when lots are considered instead of quantity, sets are still worth more.
Now, I realize there may be a bit of a survivorship bias here: The items for
sale in your store, are items that have not sold, not items that have. But I'm
skeptical that a single brick is worth more than a single set, unless you've
sold several hundred of these:
And even then, this item is technically categorized as a gear, not a brick.
|
We are not really interested in averages only totals. As for sets - ours are
almost all polybags which are classed as sets by Bricklink but are not really
sets. We sell 10's of thousands of bricks every month, when we can get our
hands on them and maybe one or 2 polybags every 6 months so I know where our
emphasis should be.
So for sure there are numerous ways to look at stats. Ours were presented in
our way which hopefully were understood. The averages have no real meaning to
us.
|
|
|
| | | | | | | | | | | | | | | | | |
| | | | | | | | | | | Author: | Nubs_Select | | Posted: | Oct 4, 2022 13:59 | | Subject: | Re: 11 Years worth of data now | | Viewed: | 28 times | | Topic: | General | |
|
| |
|
| | | | | |
| | | | | Author: | TheCuteGiraffe | | Posted: | Oct 4, 2022 17:47 | | Subject: | Re: 11 Years worth of data now | | Viewed: | 32 times | | Topic: | General | |
|
| Woah!!
Thats really cool.
Hm, surprises me that bricks is more than plates.
|
|
| | | | | |
| | | | | Author: | axaday | | Posted: | Oct 10, 2022 15:32 | | Subject: | Re: 11 Years worth of data now | | Viewed: | 33 times | | Topic: | General | |
|
| In General, calsbricks writes:
| | Our inventory is in direct proportion to this little chart and has been for many
years. It will be differnt breakdowns by different regions, store specialisation
etc.
Our product families are our own internal 1 level up from Bricklink categories
e.g Bricks equals all the sub undeer bricks e.g modified, round etc.
Anybody else produce data like this? I am pretty sure qwertyboy does - right
Niek ?
|
Are you sourcing inventory from new sets?
Because as long as you aren't having something (tiles for example) stacking
up in your closet, this chart should be determined by the composition of sets.
Everybody should have roughly the same breakdown.
|
|
| | | | | | | | | |
| | | | | | | Author: | SylvainLS | | Posted: | Oct 10, 2022 15:45 | | Subject: | Re: 11 Years worth of data now | | Viewed: | 38 times | | Topic: | General | |
|
| In General, axaday writes:
| | […]
Are you sourcing inventory from new sets?
Because as long as you aren't having something (tiles for example) stacking
up in your closet, this chart should be determined by the composition of sets.
Everybody should have roughly the same breakdown.
|
Hmm, I think when some people say “this doesn’t sell for me at all!” they’re
always answered by “this does sell very well for me!” by other people.
So it seems people’s closets are all full… but with different parts
… But that also don’t mean the proportions are the same as what is found in sets:
maybe some parts are found in more closets than other parts.
|
|
| | | | | | | | | | | | | |
| | | | | | | | | Author: | yorbrick | | Posted: | Oct 10, 2022 17:02 | | Subject: | Re: 11 Years worth of data now | | Viewed: | 25 times | | Topic: | General | |
|
| In General, SylvainLS writes:
| | In General, axaday writes:
| | […]
Are you sourcing inventory from new sets?
Because as long as you aren't having something (tiles for example) stacking
up in your closet, this chart should be determined by the composition of sets.
Everybody should have roughly the same breakdown.
|
Hmm, I think when some people say “this doesn’t sell for me at all!” they’re
always answered by “this does sell very well for me!” by other people.
So it seems people’s closets are all full… but with different parts
|
They should probably swap closets.
|
|
| | | | | | | | | | | | | | | | | |
| | | | | | | | | | | Author: | peregrinator | | Posted: | Oct 10, 2022 17:04 | | Subject: | Re: 11 Years worth of data now | | Viewed: | 33 times | | Topic: | General | |
|
| In General, yorbrick writes:
| | They should probably swap closets.
|
If only there were an international Lego marketplace that made that sort of thing
possible
|
|
|
|
|